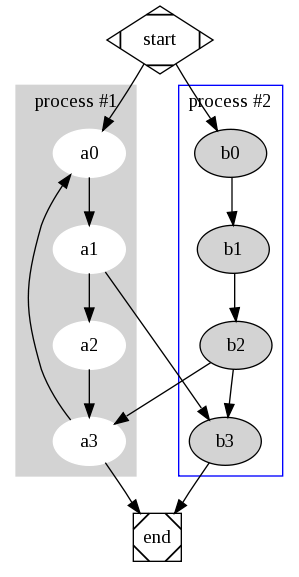
This small example illustrates dot's feature to draw nodes and edges in clusters or separate rectangular layout regions. Clusters are encoded as subgraphs whose names have the prefix 'cluster'. The color attribute of a cluster is interpreted as its outline color or its background color if its style is 'filled'. Mdiamond and Msquare are modified symbols for data flow diagrams.
digraph G {

	subgraph cluster_0 {
		style=filled;
		color=lightgrey;
		node [style=filled,color=white];
		a0 -> a1 -> a2 -> a3;
		label = "process #1";
	}

	subgraph cluster_1 {
		node [style=filled];
		b0 -> b1 -> b2 -> b3;
		label = "process #2";
		color=blue
	}
	start -> a0;
	start -> b0;
	a1 -> b3;
	b2 -> a3;
	a3 -> a0;
	a3 -> end;
	b3 -> end;

	start [shape=Mdiamond];
	end [shape=Msquare];
}