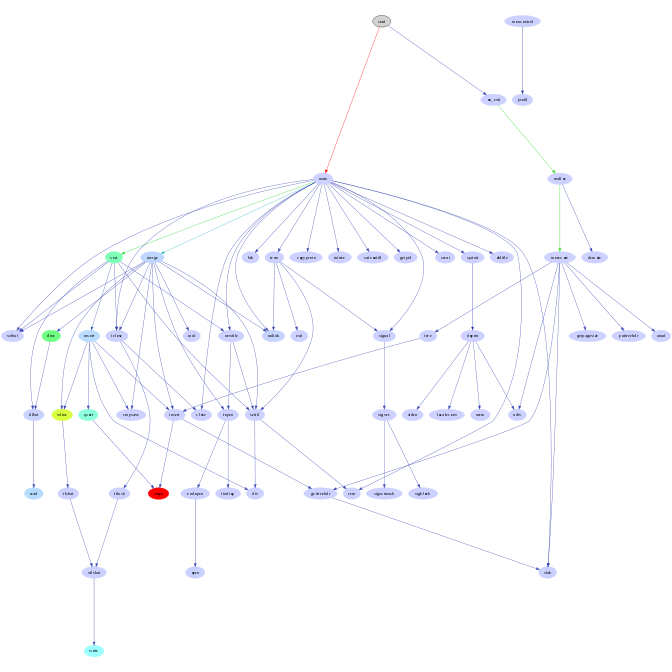
This is the dynamic profile of a sort program, generated from the 'gprof' tool. Nodes represent functions and edges represent function calls. They are colored according to gprof's estimate of the time spent within a given function and the time charged to a given call site. The colors are encoded as hue-saturation-brightness triples. We have found it advantageous to vary both hue and saturation to draw attention to hot spots, rather than present a baffling rainbow of colors.
Click on the picture to view the .gv file